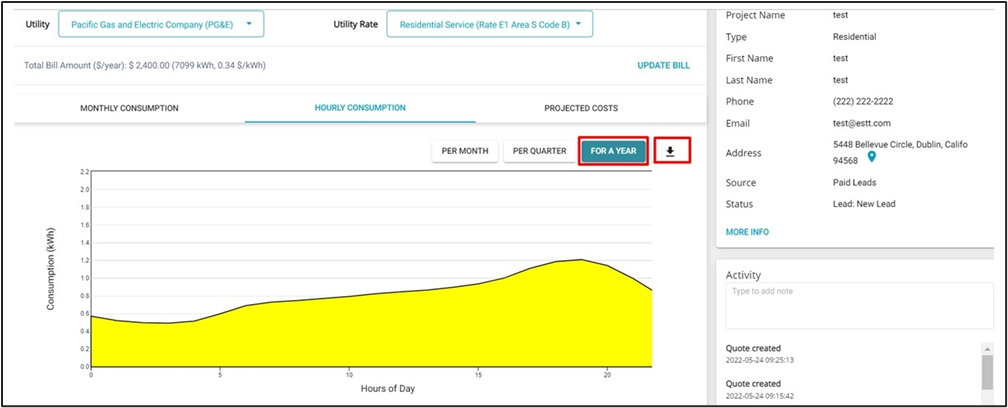
Click on “Hourly Consumption” to see the consumption profile for a month, a quarter, or a year.
You will see the download icon next to “For a Year”. Click on the icon to download the graph.
The downloaded image will be in PNG format.

Click on “Hourly Consumption” to see the consumption profile for a month, a quarter, or a year.
You will see the download icon next to “For a Year”. Click on the icon to download the graph.
The downloaded image will be in PNG format.

Comments
0 comments
Article is closed for comments.